Spot gold prices (XAU/USD) are hovering around $1,950.00 after falling in Asia. Gold prices were expected to extend losses as gains in oil prices revived concerns about a rebound in U.S. inflation following OPEC+'s decision to curb output. Rising oil prices could force factory owners to raise prices for goods and services at the factory gate, which would boost the producer price index (PPI). Ultimately, inflationary pressures in the US will be pushed up substantially.
The backdrop of rising inflation expectations has injected fresh blood into the U.S. dollar index (DXY). The U.S. dollar index hit a weekly high above 103.00 as investors believed the Federal Reserve (FED) would have no choice but to trigger a rise in interest rates. Fed Chairman Jerome Powell is likely to announce a 25 basis point hike in May and push rates above 5%.
Another catalyst that had a big impact on gold prices was the easing of jitters in the U.S. banking sector. Investors have priced in the short-term panic following the collapse of three mid-sized banks and are hoping there will be no further casualties ahead.
Meanwhile, S&P 500 futures failed to recover losses in the morning session as higher oil prices could lead to higher operating costs for oil-dependent companies. The yield on the 10-year U.S. Treasury note has jumped above 3.52%.
In the short term, it is expected that the price of gold will still have further downside risks, but the US ISM manufacturing PMI data for March will be released in the evening, and the market is expected to be poor, which is expected to provide some support for the price of gold.
In addition, investors need to pay attention to OPEC+ holding an online meeting of the ministerial committee including Russia and Saudi Arabia, and pay attention to changes in market expectations for other economic data such as non-farm payrolls this week.
Spot Gold Technical Analysis
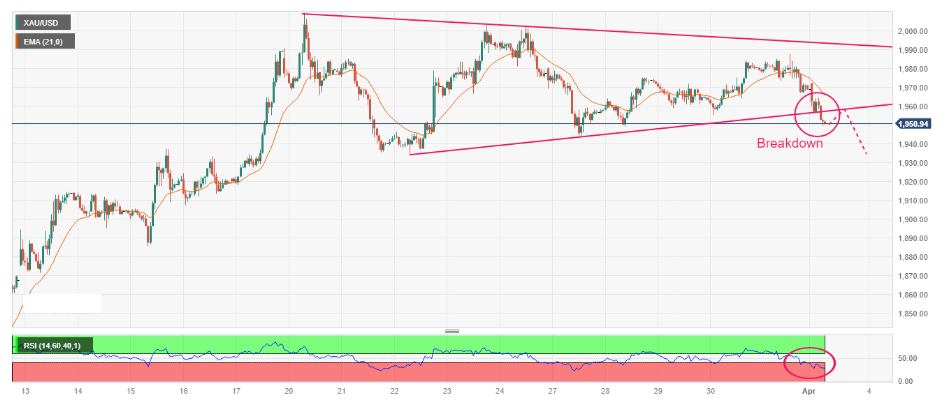
The price of gold fell below the symmetrical triangle on the 1-hour chart, which led to a rise in volatility, volume and price, and a rapid rise in volatility.
The relative strength index RSI (14) fell into the bearish range of 20.00-40.00, indicating that gold prices are in a downward momentum.
The falling 21EMA at $1966.20 suggests that the price of gold will extend its decline.
Gold bears need a daily close below key uptrend line support (currently at $1961) to confirm a break below the pennant pattern from two weeks ago.
If this happens, the price of gold does not rule out the possibility that it will fall again to the previous week's low of $1,944.
Further below, the triangle's ascending trendline from the March 22 low of $1,934.34 acts as an important support for the bulls.
Once the gold price rebounds, the bulls need to recover the above-mentioned trend line support at $1961 in a sustained manner.
The next upside target is the round number of $1970.
The falling resistance line at $1993 will act as a strong hurdle for the bulls.
Spot Gold one hour chart

JRFX shares news information and professional technical analysis on foreign exchange, spot gold or crude oil every trading day. Follow us so as not to miss the market focus of the day and grasp the trading market in time.
JRFX reminds you: the market is risky, and investment needs to be cautious. This article does not constitute personal investment advice. Please choose corresponding investment products according to your own financial and risk tolerance, and do a good job in corresponding risk control.
About JRFX
· 12 years of financial market experience, the choice of more than 4 million customers, one of the most respected foreign exchange brokers in the world
· Provide 50+ trading products, including foreign exchange, spot gold, crude oil, stocks, indices, cryptocurrencies, etc.
· Three trading accounts to meet the investment needs of different customers
· Zero commission, low spread, leverage up to 1:1000
· You can open an account with a minimum deposit of 100 US dollars only