Spot gold (XAU/USD) hit a fresh intraday low around $1,985 during the European session on Friday. In the process, gold remained subdued, tracking falling U.S. Treasury yields through the end of an active week.
The dot plot of the Fed's interest rate shows that the federal funds rate is expected to reach 5.1% by the end of 2023, in line with the median forecast of Fed officials in December, suggesting that this round of interest rate hikes will end after one more rate hike this year. And Fed Chairman Jerome Powell also admitted that a short-term interest rate hike may be paused, which basically gave investors a green light. Gold, as a non-yielding asset, will be under less pressure as the Fed's interest rate hike cycle is coming to an end.
In addition, US Treasury Secretary Yellen's previous assurances that all bank deposits are safe have eased concerns about a banking crisis. However, that appears to be changing now, with Yellen saying on Wednesday that the government is "not considering insuring all uninsured bank deposits". Smaller banks could be at risk of deposit flight following Yellen's U-turn on comments on covering uninsured deposits. The bank failure crisis seems to be still deeply buried. Then, as a safe haven, gold, under the chaotic situation, highlights its investment value even more.
The Fed's massive lending amid the banking rout has fueled concerns about a ballooning Fed balance sheet, which in turn has revived hawkish calls for the U.S. central bank's next move and lured gold bears near multi-day highs.
David Meger, director of metals trading at High Ridge Futures, said that if they do pause, it would give the green light to the gold market, which is the classic inflation hedge. "If they fail to raise rates further, inflation will likely remain high," he added.
Goldman Sachs raised its 12-month gold price target to $2,050 an ounce from $1,950, saying gold is the best hedge against financial risks.
However, mixed U.S. data and the latest Fed statement appeared to challenge the policy hawks. Also challenging the greenback were comments from major market players such as DoubleLine's Gundlach, who recently reiterated his dovish bias towards the U.S. central bank.
Elsewhere, comments from US Treasury Secretary Janet Yellen and the chairman of the Basel Committee on Banking Supervision, which painted fears of bank failures, also weighed on sentiment and challenged gold buyers . However, a pullback from the recent market consolidation has gold buyers consolidating recent gains ahead of key data/events.
Meanwhile, U.S. 10-year and 2-year Treasury yields remain subdued at around 3.38% and 3.78% respectively, while S&P 500 futures struggle to replicate Wall Street's positive move.
The European Central Bank is still inclined to raise interest rates further, which makes gold bulls apprehensive, but the Bank of England is approaching the end of the rate hike cycle, the market has also lowered the Fed's terminal interest rate expectations, US bond yields weakened, geopolitical tensions, European and American banking turmoil , These are expected to provide further opportunities for gold prices to rise.
This trading day will usher in the first reading of the S&P Global Purchasing Managers Index PMI in March in Europe and the United States. Investors need to pay attention to it, focusing on the monthly rate of durable goods orders in the United States in February. The market expects a month-on-month increase of 0.6%. In addition, you need to pay attention to the speeches of Fed officials.
Gold Technical Analysis
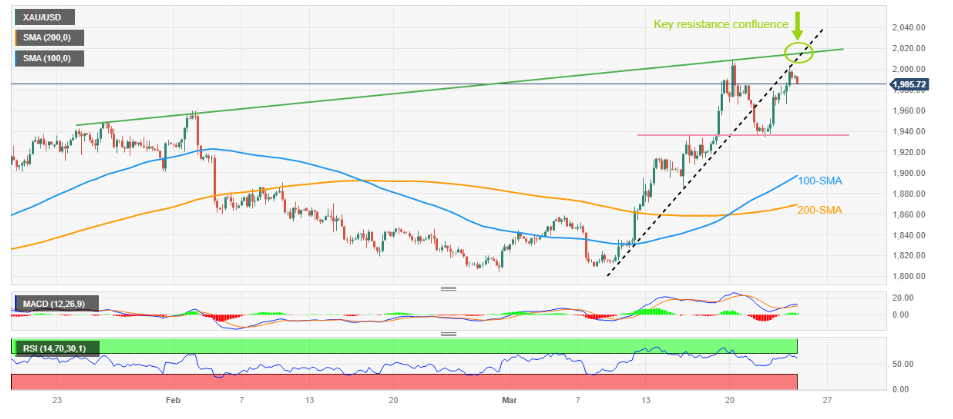
Gold's rebound from horizontal support from a week ago fades as the former support line in early March hits XAU/USD bulls amid a retracement of the RSI.
However, the bullish MACD signal and the precious metal’s indecision to embrace the bear market, as shown by the 100-period MA successfully crossing the 200-period MA, kept gold buyers hopeful.
In other words, before the above-mentioned horizontal line around $1935, the previous month's high of about $1960 is the initial support of gold/dollar, which needs to be paid attention to when the gold price weakens further.
After that, gold sellers can target buyers’ last lines of defense, the 100-period and 200-period SMAs, around $1,898 and $1,869, respectively.
In addition, the round number of $2,000 may become an immediate upward obstacle for gold prices.
However, the confluence of the rising trend line on January 26 and the support line two weeks ago at about $2,015 appears to be a difficult resistance for gold buyers.
Should gold rise above $2,015, a rebound towards the previous yearly high near $2,070 cannot be ruled out.
Gold four hour chart

JRFX shares news information and professional technical analysis on foreign exchange, spot gold or crude oil every trading day. Follow us so as not to miss the market focus of the day and grasp the trading market in time.
JRFX reminds you: the market is risky, and investment needs to be cautious. This article does not constitute personal investment advice. Please choose corresponding investment products according to your own financial and risk tolerance, and do a good job in corresponding risk control.
About JRFX
· 12 years of financial market experience, the choice of more than 4 million customers, one of the most respected foreign exchange brokers in the world
· Provide 50+ trading products, including foreign exchange, spot gold, crude oil, stocks, indices, cryptocurrencies, etc.
· Three trading accounts to meet the investment needs of different customers
· Zero commission, low spread, leverage up to 1:1000
· You can open an account with a minimum deposit of 100 US dollars only